Comparing Means by Category
The text below is a transcript of the video above, edited with AI assistance for clarity and flow. Where the two differ, the video is the authoritative version.
You’ll learn to
In this video we continue to look at correlations between variables, this time with a different pairing of variable types: we compare means by category. You will learn to:
- Summarise differences between groups by comparing group means.
Political preferences (left-right self-placement)
As always, we are looking at two variables. The first of the pair whose correlation we are going to examine is political preference. We use data from the British Election Study and look at the distribution of self-placed ideology. Respondents were asked to place themselves on a scale from 0 to 10, where 0 means left and 10 means right.
- Mean: 4.75
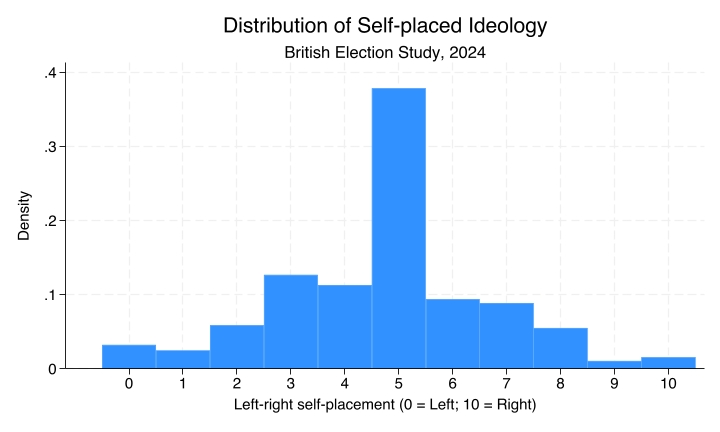
You can see that most respondents consider themselves to be right at the centre. Most British people say five when asked to position themselves between 0 and 10 on a scale of political preferences.
Newspaper readership
The other variable is newspaper readership. The British Election Study asked respondents which newspaper they read most commonly, and offered a list of options.
- Mode: Guardian/Observer - 281 readers (22.8%)
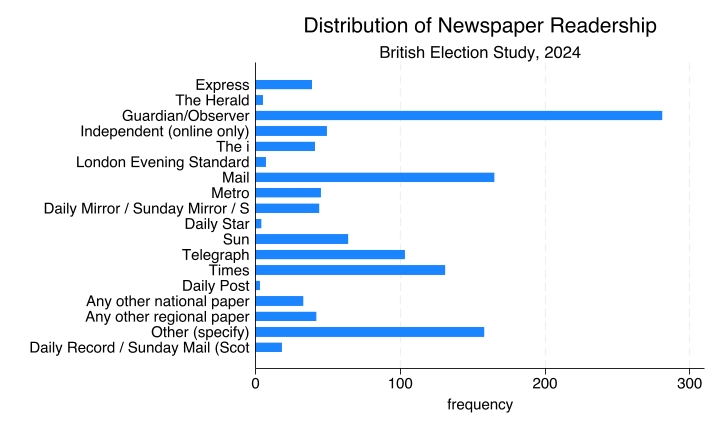
Notice the difference in types. The left-right self-placement is an interval variable, and we looked at it with a histogram. Newspaper readership is a nominal variable, and here we have a frequency bar chart. The mode, the most frequent observation, is the Guardian or the Observer, with 281 readers, corresponding to almost 23% of the British Election Study respondents.
Political preferences and choice of newspaper
The idea is to look at the correlation between these two variables. Different media outlets report the news with different perspectives. Do these differences reflect the political preferences of their readers?
Correlations between variables
Again, two variables are correlated if knowing the value of one variable tells you something about the likely value of the other. In this case: do readers of different newspapers have different political preferences? If so, there is a correlation. If not, if they have similar preferences, there is no correlation.
Newspaper and preferences: bar chart
This is the chart that plots the correlation between the two variables:
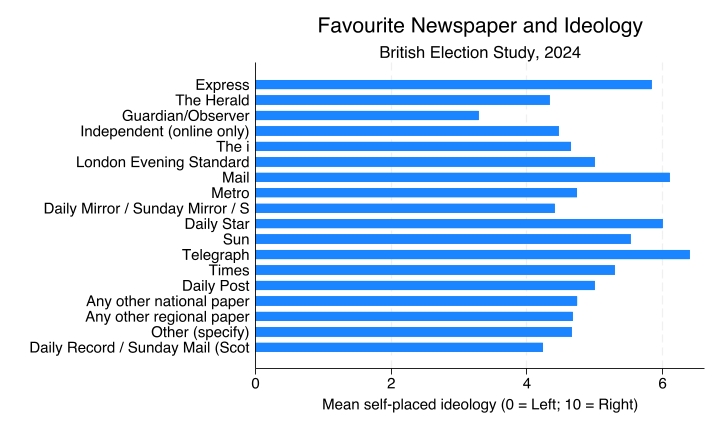
Notice that this bar chart looks the same as the newspaper readership chart above. They look the same, but they are different. The earlier chart reports the frequency: the number of people in the sample, the number of observations, that fall into each category. There, the most read newspaper is the Guardian, which has a large bar showing that 281 people said they prefer to read the Guardian.
This one is a bar chart with means. It no longer gives you information about how many people selected each newspaper. Now each bar is the mean self-placed ideology. Larger bars mean that the people who read that newspaper tend to lean to the right; smaller bars mean they tend to lean to the left. So the Guardian here has the smallest of the bars, not the largest, because we are looking at mean self-placed ideology, where zero means left, and Guardian readers lean left according to the British Election Study data, at least compared to readers of other newspapers.
Newspaper and preferences: comparing means
These are the means for some selected newspapers:
| Newspaper | Mean left-right self-placement |
|---|---|
| Guardian/Observer | 3.29 |
| Independent | 4.47 |
| Times | 5.29 |
| Daily Mail | 6.1 |
| Telegraph | 6.4 |
For the Guardian or Observer the mean is 3.29. The Independent, at 4.47, and the Times are close to the centre. Then it gets more right-wing with the Daily Mail and the Telegraph.
The descriptive evidence seems to indicate that yes, there is a correlation, where Guardian readers lean left and Telegraph readers lean right. That is not very surprising, given what we know about the UK media ecosystem.
Recap
- When one variable is nominal and the other is numeric (interval or ratio), compare the mean of the numeric variable across categories.
- A bar chart with means shows the average value of one variable across the groups of the other variable.
- Larger differences between group means suggest a stronger association between the variables.
Compare this with the gender and vote choice example, which paired two nominal variables. Here we are looking at favourite newspaper and mean ideology: one nominal variable and one interval variable. In this case, we compare means between groups.
Why this matters
Describing group differences is the foundation for asking why those differences exist. We have now looked at a different pairing of types of variables, one that lets us compare means between groups. Keep in mind that these differences in types of variables matter for the choice of tables and charts that we use and produce to analyse correlations.