Scatterplots and Regression Lines
The text below is a transcript of the video above, edited with AI assistance for clarity and flow. Where the two differ, the video is the authoritative version.
You’ll learn to
To continue learning about correlations between variables, we now look at scatterplots and regression lines. Numeric here means interval or ratio, so this is the case where both variables are interval or ratio. You will learn to:
- Interpret scatterplots and regression lines to analyse correlations between numeric variables.
Support for Brexit across UK regions
We are going to look at data on voting for Brexit across different regions of the UK. Here you see the map of the vote share of the Leave option by region.
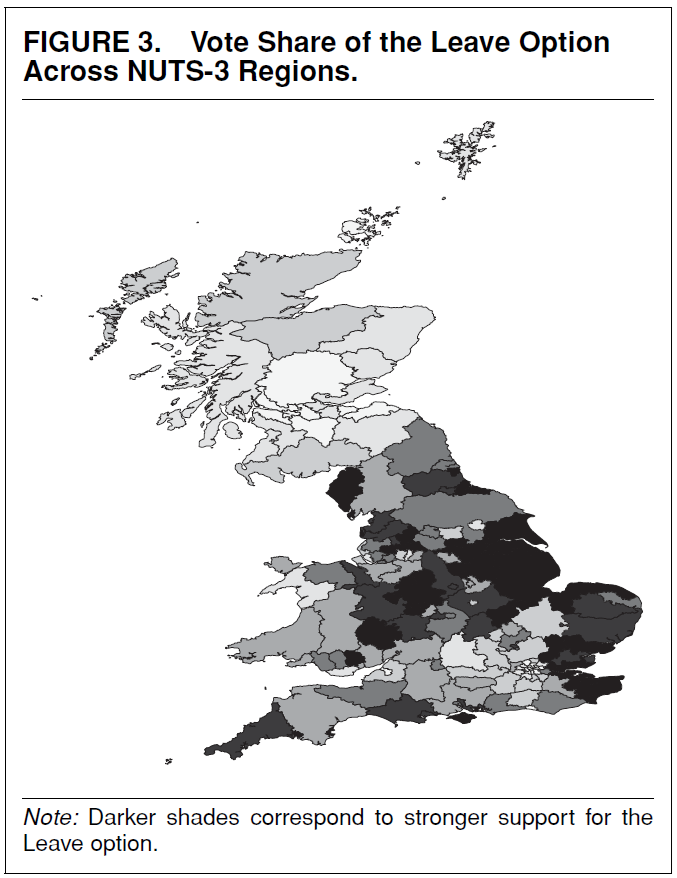
The data we use is the replication data for this paper, which reports on the factors that explain support for Brexit across regions of the UK.
What variables are correlated with support for Brexit?
What variables go together with support for Brexit? We start with the histogram of the share of Leave votes by region of the UK.
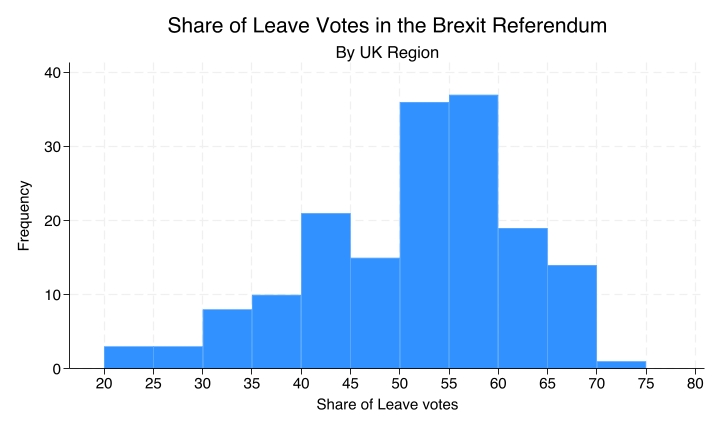
The histogram shows the number of regions at each level of Leave support. About 35 regions had between 50 and 55% of Leave votes, and a little more than that had between 55 and 60%.
Competition from imports?
Is it competition from imports?
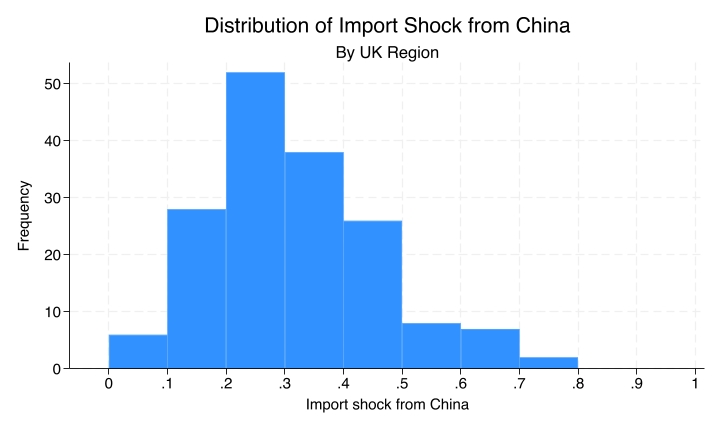
This is a measure of the extent to which each region of the UK was economically hurt by competition from imports flowing from China. If a region employs a lot of people in an industry that has been competing with imports from China, that region has a higher score. It is measured between zero and one, and the paper has a more thorough explanation of it.
Here we take the measure at face value, just for the sake of learning. You should never take measurements at face value, as discussed in previous videos, but for the purpose of looking at the correlation we treat this as a reliable measure of the import shock at the regional level.
Immigration presence?
Another variable that could be correlated with support for Brexit is the share of foreign-born residents.
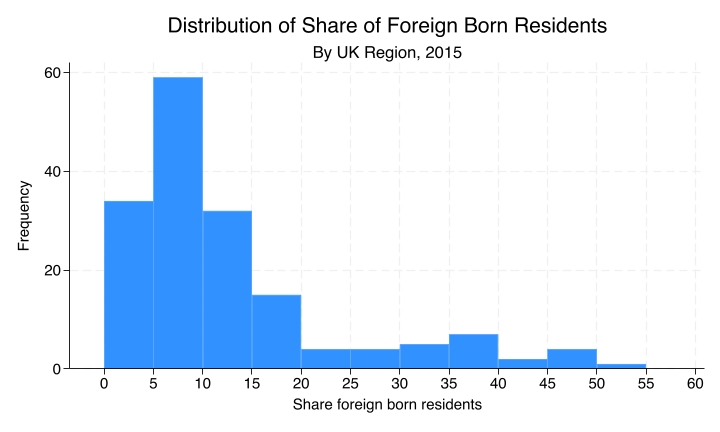
This is the distribution of that share: the number of regions that fall within each bin (between 0 and 5%, between 5 and 10%, and so on) of residents who were born outside of the UK.
Unemployment rates?
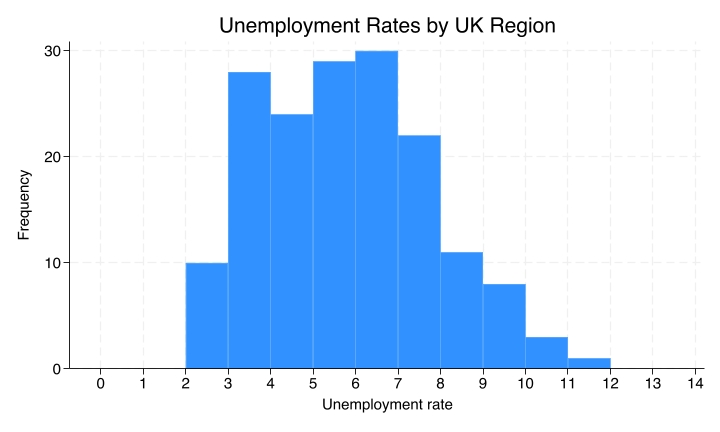
Another one could be unemployment rates. Maybe support for Brexit was higher in regions with higher unemployment.
Correlations between variables
Again, two variables are correlated if knowing the value of one variable tells you something about the likely value of the other.
Let us start with the import shock. If the import shock tells us nothing about Leave support, there is no correlation. If, on the other hand, regions with higher import shocks tend to have different levels of support for the Leave option, then there is a correlation between these two variables.
Setting up the scatterplot
We start with a blank canvas, so that you know step by step what we are looking at.
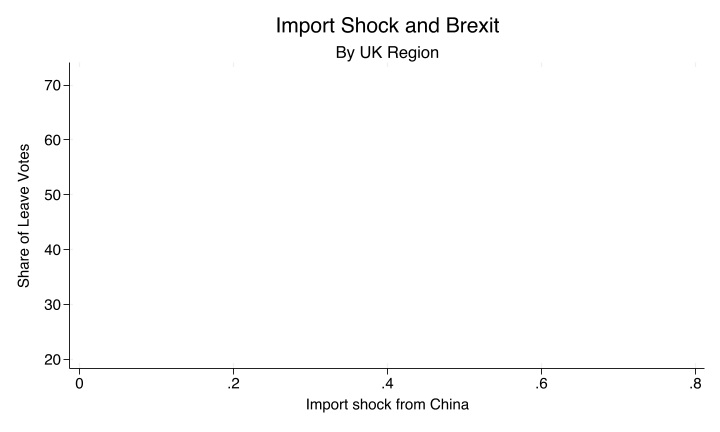
The share of Leave votes is on the y-axis, the vertical axis, and the import shock from China is on the x-axis, the horizontal axis. When we are trying to make inferences about the likelihood of there being causation, for instance if we are trying to say that the import shock from China made support for Brexit more likely, the convention is to put the independent variable on the x-axis, the horizontal axis, and the dependent variable on the y-axis, the vertical axis. This is how we set up the scatterplot.
Each dot is a region
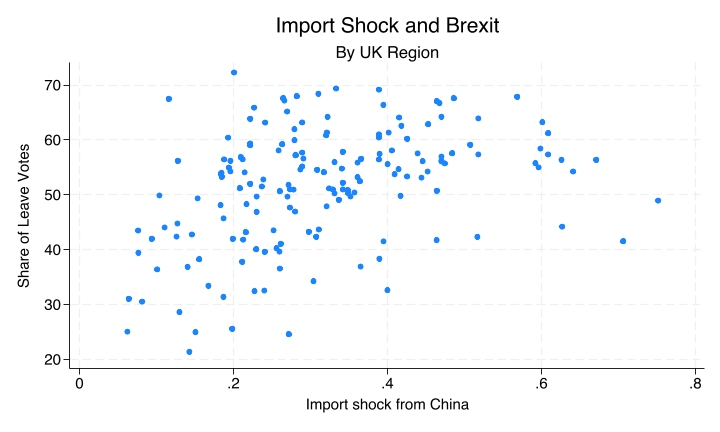
Each region is represented by a dot. From each dot you can gather what the import shock from China was and what the share of Leave votes was in that region.
The regression line summarises the pattern
With so many points, it can be hard to see the overall pattern. The regression line is the line that best summarises the relationship: it is the line of best fit.
An upward slope means the variables tend to move together: when one variable goes up, the other goes up. A downward slope means they move in opposite directions. In both cases the variables are correlated. In one case they are positively correlated; in the other they are negatively correlated.
Import shock and Brexit
For the import shock and the share of Leave votes, we see a positive correlation.
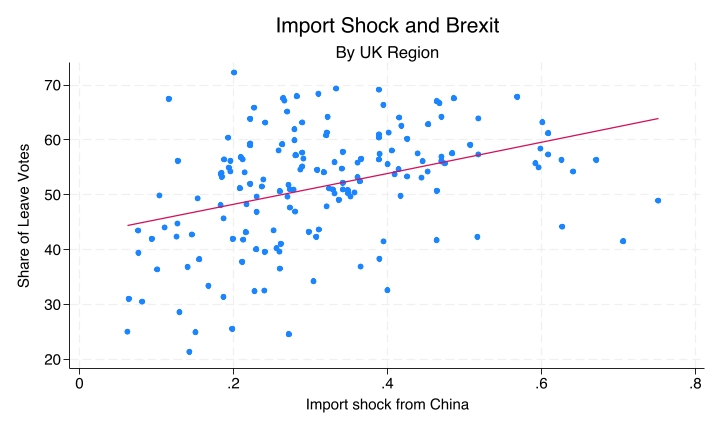
The higher the import shock, the greater the likelihood of a higher share of Leave votes. The upward slope of the regression line, the line of best fit, summarises this.
Immigration and Brexit
When we look at immigration, with the share of foreign-born residents now on the x-axis, the downward-sloping line shows a negative correlation.
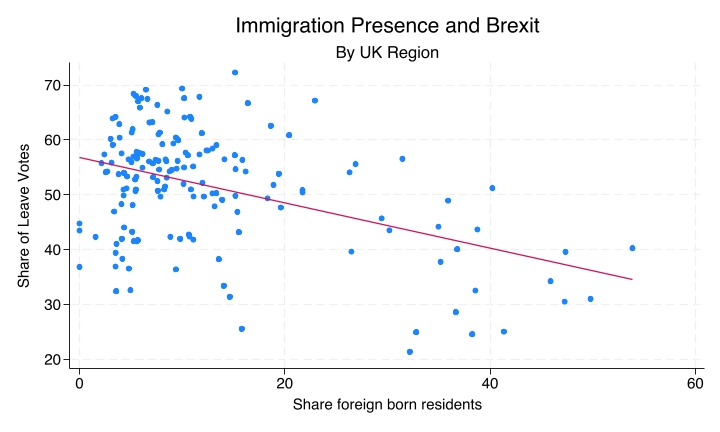
In regions of the UK with more immigrants, there was lower support for Brexit. One could have thought that in regions with more immigrants people would react negatively, but it is the opposite.
We should be careful about interpreting causation here, though. It is likely that immigrants would rather move into regions where people would not be hostile to them, so there is a selection effect as well. But in terms of a correlation, we can clearly see a negative one: the higher the share of foreign-born residents, the lower the likelihood that the region supported Brexit.
Unemployment and Brexit
When we look at unemployment and Brexit, we see no correlation.
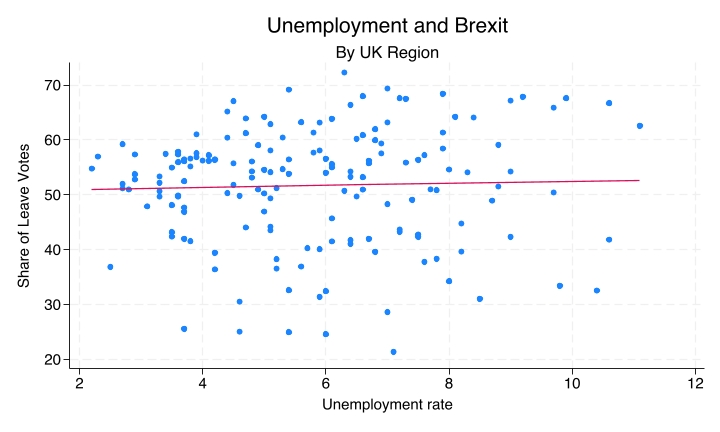
The line is almost entirely flat. You get similar levels of support for Brexit in regions with different unemployment rates, and that indicates that there is no correlation between those two variables.
Recap
This was a first introduction to scatterplots and regression lines; there is a lot more to learn about regression analysis. For now:
- When both variables are numeric (interval or ratio), use scatterplots to show their relationship by plotting each observation as a point.
- The regression line summarises the overall pattern. It is the line of best fit, the line that best fits the data.
Why this matters
Scatterplots and regression lines are common tools for analysing whether and how numeric variables are correlated: whether they are correlated or not, and whether they are positively correlated, with an upward slope, or negatively correlated, with a downward slope.
With these sets of examples we have now looked at cases of two nominal variables, cases of one nominal and one numeric variable, and now cases where both are numeric. Each calls for different types of visualisations and different types of tables to tell us whether and how the variables are correlated.