From Variable Types to Plots and Tables
The text below is a transcript of the video above, edited with AI assistance for clarity and flow. Where the two differ, the video is the authoritative version.
You’ll learn to
Choosing the wrong table or the wrong plot to analyse certain variables is one of the most common beginner mistakes in data analysis. In this video you will learn to:
- Choose appropriate tables, plots, and summary statistics based on the types of variables being analysed.
The decision rule
The decision rule has two steps:
- Identify the types of variables you are working with.
- Choose the appropriate descriptive tool based on those types.
Variable types: a quick reminder
Nominal variables have categories with no inherent order. The party that someone voted for, gender, and region are examples.
Then there are numeric variables. From here on we treat interval and ratio variables as two types described by one umbrella term, numeric. Numeric variables include interval variables and ratio variables.
Three cases to memorise
When describing correlations between two variables, you have to remember three cases:
- Nominal + Nominal: both variables are nominal.
- Nominal + Numeric: one variable is nominal and the other is numeric.
- Numeric + Numeric: both variables are numeric.
For each of these three cases, a different set of tables and charts is appropriate: one type of chart, and one type of table or analysis, for each.
Case 1: Nominal + Nominal
In the first case both variables are nominal. The example we have worked with is gender and vote choice. The tools are:
- Cross-tabulation (with row or column percentages)
- Bivariate bar chart
Row or column percentages refers to which group you want the percentages by. Do you want to see what percentage of women voted for each party, or what percentage of the voters of each party are women? This distinction matters. We have been looking at percentages within genders, to analyse whether women or men were more likely to vote for one party or another.
The cross-tabulation is the table, the numbers we are looking at. The bivariate bar chart also helps us look at the correlation between two nominal variables.
Here is the table:
| Women | Men | |
|---|---|---|
| Labour | 44% | 43% |
| Cons | 19% | 22% |
| Lib Dem | 12% | 10% |
| Green | 9% | 5% |
| Reform | 9% | 13% |
Within men, for instance, 43% voted Labour, and then you have the percentages for the other parties. We can see that the likelihood of a woman or a man voting Labour is similar, but very different when you look at, for example, voting Green or voting Reform.
Case 2: Nominal + Numeric
The second case is when we have one nominal variable and one numeric variable. The example is favourite newspaper and the person’s political preferences. The tools are:
- Compare means by category
- Bar chart of means
We compare the means by category and use a bar chart that plots those means for each of the categories. Remember that this bar chart looks similar to a frequency bar chart, so we have to pay attention to what is on each axis of the chart.
Here is the example, comparing the mean left-right self-placement of the readers of different newspapers:
| Newspaper | Mean left-right self-placement |
|---|---|
| Guardian/Observer | 3.29 |
| Independent | 4.47 |
| Times | 5.29 |
| Daily Mail | 6.1 |
| Telegraph | 6.4 |
Case 3: Numeric + Numeric
In the third case both variables are numeric. The example we have looked at is import shock and Brexit. The tools are:
- Scatterplot
- Regression line
In terms of numeric tables, you will learn more about that later with regression analysis, which is a topic of its own with a lot of concepts and a lot of moving parts. For now, it suffices to know that the regression line is the line that best fits the data, and that we look at the slope of that line.
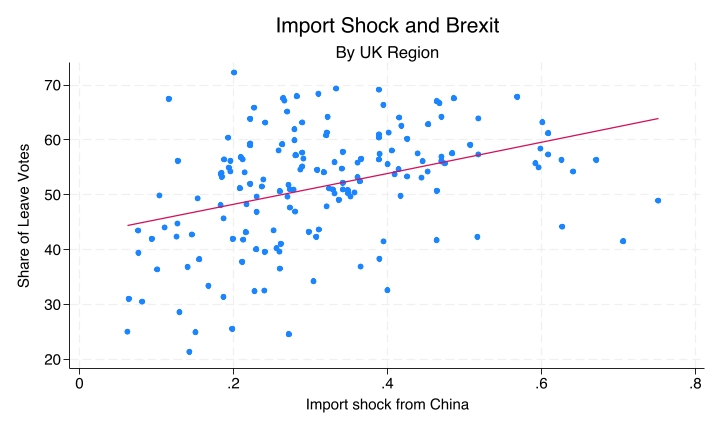
Here, for example, we have an upward slope, showing that there is a positive correlation between import shock and the share of Leave votes. The stronger the import shock, the higher the likelihood of high support for Brexit, by region of the UK.
A common mistake: wrong tool for variable types
It is a very common mistake to use the wrong tool for the variable types. One example is using a scatterplot when both variables are nominal, like plotting gender against the party voted for. Someone could load a dataset and try to produce a scatterplot of gender, coded 1 for male and 2 for female, against party, coded 1 for Labour, 2 for Conservative, and so on.
Why this is a problem
This is a problem because the numeric codes are completely arbitrary. They do not represent quantities. It is not that Conservative is twice Labour, or that female is twice male. If you try to plot these numbers as a scatterplot, you will see something that is absolutely meaningless.
A scatterplot implies that there is a relationship in which those quantities really mean something. In reality there is no meaning to those numbers: they are coding conventions of whoever gathered the data. So remember: if both variables are nominal, you do not want a scatterplot. You want a cross-tabulation and a bivariate bar chart (Case 1: Nominal + Nominal).
Another common mistake: treating numeric as nominal
Another common mistake is treating a numeric variable as nominal: for example, using a cross-tabulation when both variables are numeric, such as a frequency table of age by income with every unique value as a category.
You lose the quantitative information here, the fact that 25 is closer to 26 than to 65. You lose the richness of information that a scatterplot and a regression line can give you if you treat numeric variables as if they were nominal. The correct tool is the scatterplot and the regression line (Case 3: Numeric + Numeric).
Summary table: quick reference
Remember this table:
| Var 1 | Var 2 | Tools |
|---|---|---|
| Nominal | Nominal | Cross-tabulation, bivariate bar chart |
| Nominal | Numeric | Compare means, bar chart of means |
| Numeric | Numeric | Scatterplot, regression line |
If both variables are nominal, you want a cross-tabulation with a bivariate bar chart. If one is nominal and the other is numeric, you want to compare the means, with a bar chart of means. If both are numeric, you want the scatterplot and the regression line. These are the different cases, each with its own appropriate set of tables and charts.
Recap
- Start with variable types, then choose the appropriate descriptive tool. Before you try to produce any charts, classify each variable and work out whether both are nominal, one is nominal and the other numeric, or both are numeric. Then map that onto the correct choice of tables and charts.
- Nominal + Nominal: cross-tabulation and bivariate bar chart.
- Nominal + Numeric: compare means by category and bar chart of means.
- Numeric + Numeric: scatterplot and regression line.
Why this matters
The wrong tool for the wrong variable types produces meaningless or misleading output, and software will not stop you from making that mistake. If you ask software for a scatterplot of gender and vote choice, you will get a scatterplot of gender and vote choice, but it will be a scatterplot that means nothing and tells you nothing about the data. Keep that in mind: it is a very important lesson to carry with you as you learn how to analyse data.