R-squared
The text below is a transcript of the video above, edited with AI assistance for clarity and flow. Where the two differ, the video is the authoritative version.
You’ll learn to
The R-squared is an important quantity that you get with every regression. In this video you will learn to:
- Define R-squared and explain what it measures.
- Interpret R-squared as a percentage of explained variance.
- Understand what R-squared does and does not tell you.
What the R-squared measures
The R-squared measures the proportion of variance in y that is explained by x: the proportion of variance in the dependent variable that is explained by the independent variable. It always lies between 0 and 1, and it is also read as a percentage. If you have an R-squared of 0.30, that means 30% of the variance explained.
The formula
This is the formula for the R-squared. It is one minus the residual sum of squares divided by the total sum of squares:
\[R^2 = 1 - \frac{SS_{RES}}{SS_{TOT}}\]
- \(SS_{RES}\), the residual sum of squares, is how much the model misses.
- \(SS_{TOT}\), the total sum of squares, is how much y varies in total.
Residual Sum of Squares
The residual sum of squares is the quantity that the regression minimises. The slope and the intercept that you get when calculating a regression line are such that the residual sum of squares is as small as possible. But that does not mean that it will be particularly small. It is being minimised, but if the data are laid out in such a way that the spread of the dots around the regression line is large, then you will have a large residual sum of squares.
Imagine a scatterplot with a cloud of dots around a regression line. For each dot there is a residual, which is the vertical distance between the dot and the line. The residual sum of squares is the result of squaring each of these distances and adding them up.
Take the Brexit example, with the Leave vote share and the share of the population with higher education. Each observation is a dot, and there is a predicted Leave vote share for each observed proportion of people with higher education. You have a regression line, a cloud of dots with a line in the middle, and for each dot you have a distance. When you take the distance for each dot, square it, and sum all of these squares, you get the residual sum of squares.
Larger residuals, meaning larger distances between the dots and the regression line, mean that the model’s predictions are often far off from what you actually observe.
Total Sum of Squares
The total sum of squares, by contrast, is very simply the variance of y: the total spread in the outcome. You take each observation of y minus the mean of y, you square that, and then you sum all of these squares. That gives you the variance of y, which is the total sum of squares. It is a baseline: how much y varies without any model.
Note. A simplification. Strictly, the total sum of squares is the variance of y multiplied by n − 1: the variance divides this sum by n − 1. The difference does not affect R-squared.
The logic of the formula
\[R^2 = 1 - \frac{SS_{RES}}{SS_{TOT}}\]
The logic is that if the line fits the cloud of dots well, if the cloud of dots is relatively close to the line, the residual sum of squares is small relative to the total sum of squares. When you take the sum of the squares of those vertical distances between each dot and the line, you get a small quantity relative to the variance of y. You divide one by the other, and one minus that fraction gives you a high R-squared. If the fraction is close to 0, the R-squared is close to 1.
By contrast, if the model fits poorly, the division of the residual sum of squares by the total sum of squares results in a number close to 1, and then the R-squared is close to 0.
Visual intuition: low R-squared
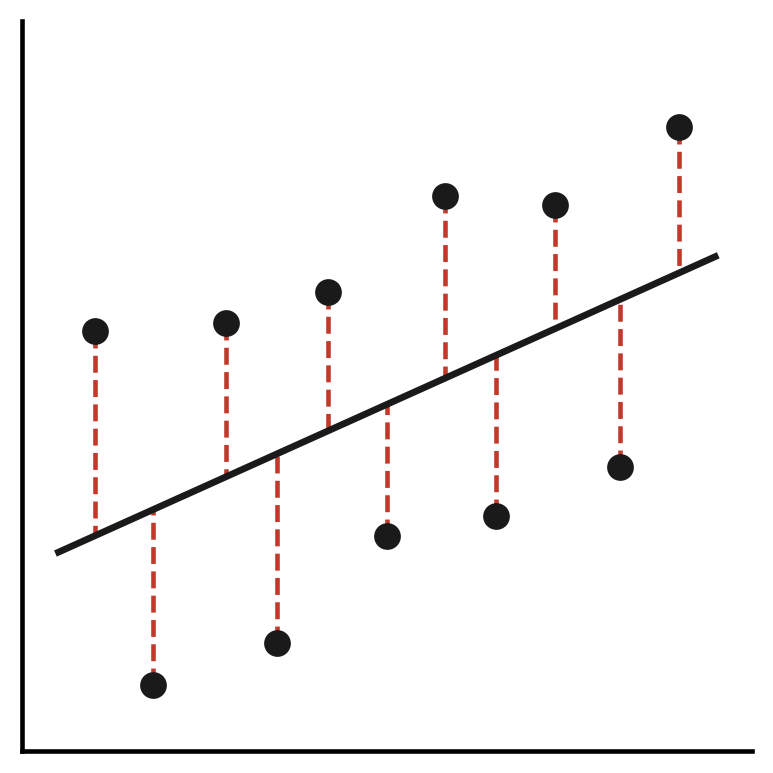
Visually, this is an example of a scatterplot that would yield a low R-squared. The distances from the dots to the regression line are relatively large, and as a result the residual sum of squares is large relative to the total sum of squares. The dots are widely scattered around the regression line, the residual sum of squares is similar to the total sum of squares (\(SS_{RES} \approx SS_{TOT}\)), and the R-squared is close to 0.
Visual intuition: high R-squared
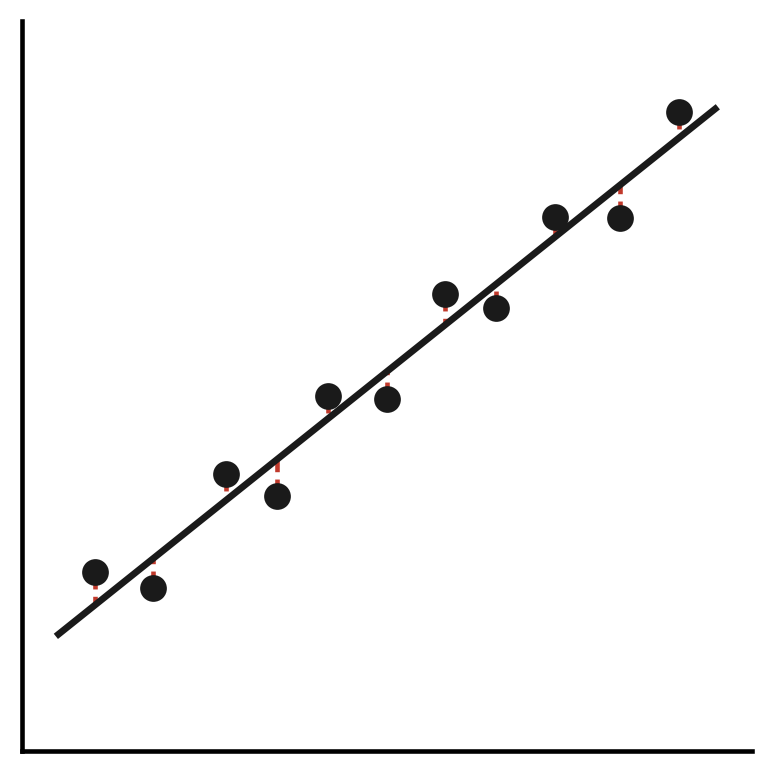
By contrast, if the dots cluster tightly around the line, the total sum of squares is much larger than the residual sum of squares (\(SS_{RES} \ll SS_{TOT}\)). If you take all of those distances between each dot and the line, square them and sum them up, you get a small quantity, much smaller than the total sum of squares. Therefore the R-squared is close to 1.
Brexit example
In the Brexit example, the regression of the Leave vote on higher education, we get an R-squared of about 0.30. The way we interpret this is that about 30% of the variation in the Leave vote share across UK regions is explained by differences in the proportion of people in each region with higher education.
What the remaining 70% means
This means that 70% of the variation in the Leave vote share is not explained by the variation in the share of people with higher education. It is not explained by education. Other factors also matter for whether a region voted more Leave or more Remain: factors like economic conditions, the demographic characteristics of the people in that region, geography, identity.
When you have a bivariate model, a model with just two variables, you only capture one piece of a more complex picture. You will rarely have a particularly high R-squared when you run a regression with just one independent variable.
What R-squared does not mean
It is important to keep in mind that a high R-squared does not mean that the relationship is causal. If you have a high R-squared, it does not mean that one thing is causing the other. And a low R-squared does not mean that the slope is either wrong or unimportant. The R-squared measures fit: the fit of the line to the dots. It is not something that you use to test hypotheses, for example.
R-squared and statistical significance
A slope can be statistically significant with a low R-squared. That is because statistical significance asks whether the slope is distinguishable from zero, while the R-squared tells you how much of y the model explains. These are conceptually different questions: one is answered by the hypothesis test, the other by looking at the R-squared. But both are important parts of interpreting the output of a regression.
Recap
- The R-squared is the proportion of variance in y, the dependent variable, explained by x, the independent variable. It is always between 0 and 1.
- A high R-squared means good fit. It does not imply that there is a causal relationship between the two variables.
Why this matters
The R-squared tells us how much work the model is doing: to what extent the model explains the variance in your dependent variable.
Bivariate R-squared values are often modest. When you have a regression with just two variables, you will often have a small R-squared. This is to be expected, because you are only using one variable to predict another, and outcomes such as the Leave vote share are usually determined by multiple factors rather than just one, such as the proportion of people in the region with higher education.
Evaluating fit is part of a responsible and transparent approach to quantitative research.