Correlations Between Nominal Variables
The text below is a transcript of the video above, edited with AI assistance for clarity and flow. Where the two differ, the video is the authoritative version.
You’ll learn to
So far you have been learning how to describe and analyse distributions for just one variable. Now you are going to start learning how to analyse correlations between variables. Another word for correlation is association: are variables associated? Do they vary together? We start with correlations when the two variables are of the same type, in this case nominal. You will learn to:
- Describe associations between two categorical variables using cross-tabulations and bivariate frequency charts.
General Election vote: Frequency table
We are going to look at the correlation between vote choice in the 2024 UK general election and gender. Vote choice is the first variable. Which party did you vote for in the general election?
| 2024 General Election vote | Freq. | Percent | Cum. |
|---|---|---|---|
| Labour | 895 | 43.74 | 43.74 |
| Conservatives | 408 | 19.94 | 63.69 |
| Liberal Democrats | 224 | 10.95 | 74.63 |
| Scottish National Party (SNP) | 75 | 3.67 | 78.30 |
| Plaid Cymru | 22 | 1.08 | 79.37 |
| Green Party | 148 | 7.23 | 86.61 |
| Reform UK | 221 | 10.80 | 97.41 |
| Other (WRITE IN) | 20 | 0.98 | 98.39 |
| An independent candidate | 33 | 1.61 | 100.00 |
| Total | 2,046 | 100.00 |
This is from the British Election Study: the number and the percentage of respondents who voted for each party in the 2024 general election.
General Election vote: Frequency bar chart
This is the same quantity represented by a bar chart.
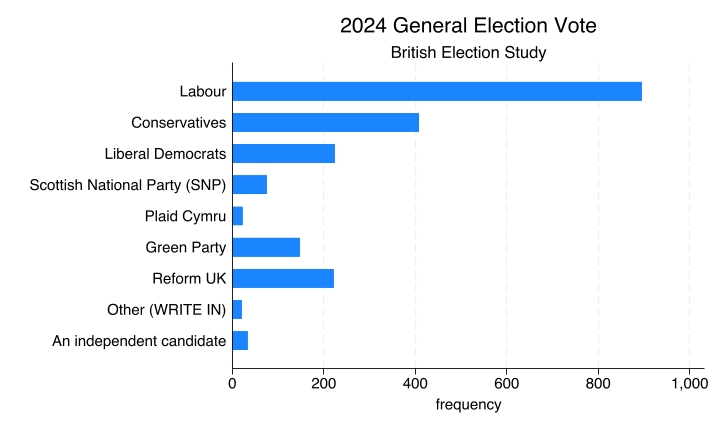
Reflecting the result of the election, a lot of the 2024 British Election Study respondents reported having voted Labour, with the Conservatives coming second, and Reform UK and the Liberal Democrats with similar numbers of people reporting having voted for them.
Another nominal variable: Gender
Another nominal variable is gender. This is the distribution of gender in the British Election Study sample, the respondents who were interviewed.
| Gender | Freq. | Percent | Cum. |
|---|---|---|---|
| Male | 1,399 | 45.29 | 45.29 |
| Female | 1,657 | 53.64 | 98.93 |
| In another way | 18 | 0.58 | 99.51 |
| Prefer not to say | 15 | 0.49 | 100.00 |
| Total | 3,089 | 100.00 |
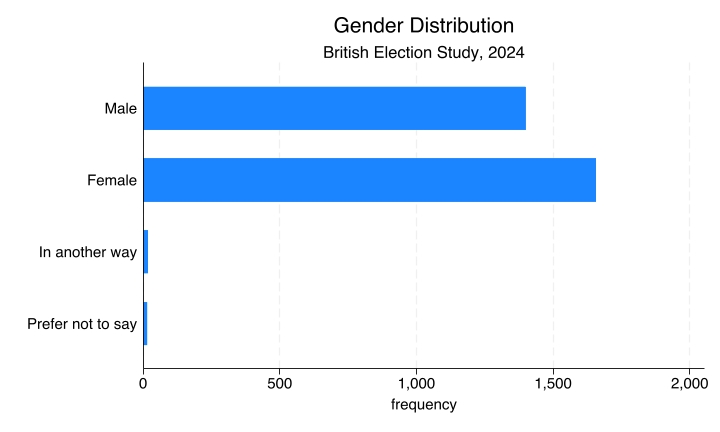
You can see that more women than men were interviewed: 45% male and 53.6% female. There is a very small percentage of people who responded that they define their gender in another way, or who preferred not to say.
This is the same distribution, now represented in a bar chart with frequencies.
Gender and vote: How do they correlate?
How do these two variables, gender and vote choice, correlate?
- Do men and women vote differently?
- If so, for which parties do we see the biggest gaps?
Correlations between variables
Two variables are correlated if knowing the value of one variable tells you something about the likely value of the other. For gender and vote: if men and women vote similarly, there is no correlation. If they vote differently, there is a correlation.
Gender and vote: cross table
This is a cross table.
| 2024 General Election vote | Male | Female | In another way | Prefer not to say | Total |
|---|---|---|---|---|---|
| Labour | 406 43.19% |
479 44.07% |
6 50.00% |
4 57.14% |
895 43.74% |
| Green Party | 46 4.89% |
98 9.02% |
4 33.33% |
0 0.00% |
148 7.23% |
| Reform UK | 124 13.19% |
96 8.83% |
0 0.00% |
1 14.29% |
221 10.80% |
For the sake of space in this presentation, it focuses on Labour, the Green Party and Reform UK; the full cross table would have all of the parties. Look at the percentages within each gender:
- For Labour: 479 women (44%) and 406 men (43.2%). The percentage of women who voted Labour is similar to the percentage of men who voted Labour.
- For Green: 98 women (9%) and 46 men (4.9%). Women were more likely to vote Green.
- For Reform: 96 women (8.8%) and 124 men (13.2%). Men were more likely to vote Reform.
So here you can see that yes, there is a correlation. This descriptive look at the data reveals it: men and women have similar rates of voting Labour, but they vote Green and Reform at very different rates.
Gender and vote: bivariate frequency chart
This is a bivariate frequency chart.
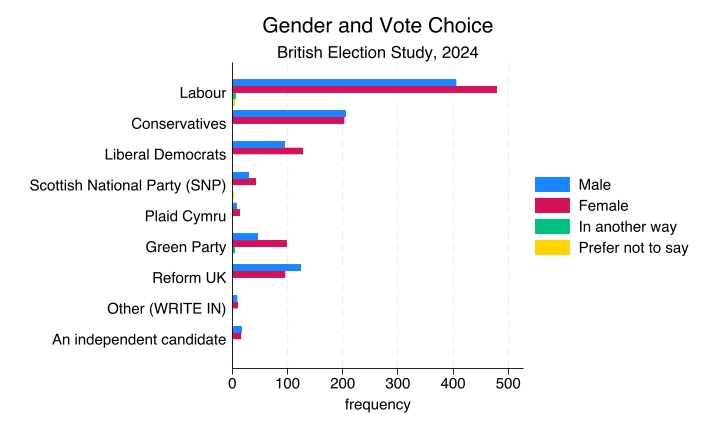
You still have the count, but now the bars are split by colour, with each colour representing a gender, that is, a response to the gender question in the British Election Study.
Interpreting the gender gap
One thing to note when you are looking at the bar chart is that the count difference for Labour is larger than the count difference for Green: 73 more women voted Labour, and 52 more women voted Green. This makes it look as if the difference in how men and women vote is larger for Labour. However, the percentage difference is much smaller for Labour (0.8 points) than for Green (4.1 points). The count difference is an artefact of the fact that more people overall voted Labour.
So when you are looking at charts, pay attention to that and focus on the percentages. Use percentages, not counts, to compare group likelihoods. Look at the percentages within each group: what percentage of men voted for this party, and what percentage of women voted for this party. That is a better way to look at this correlation and to see the extent to which the groups differ. Keep this in mind whenever you are producing your own charts and tables.
Recap
- When both variables are nominal, use bivariate frequency charts and cross-tabulation to analyse if they are correlated.
- When comparing groups, focus on percentages rather than raw counts to assess relative likelihoods: the likelihood that observations falling within one group of a variable fall in a given group of another variable.
Why this matters
Describing associations is the first step toward asking why they exist, for example why men vote differently from women. This video is a first opportunity to understand how to identify a correlation. Subsequent videos look at tables and charts that plot correlations for other types of variables. We start here with the case where both variables are nominal: in this example, vote choice and gender.