Measuring Variables
The text below is a transcript of the video above, edited with AI assistance for clarity and flow. Where the two differ, the video is the authoritative version.
You’ll learn to
Choosing a good measurement strategy is one of the most important steps of any research project. In this video you will learn to:
- Evaluate how measurement strategies shape the conclusions that research can support.
Example: Education levels and democratisation
Let’s look at an example of a causal research question.
Research question: Do higher levels of education make countries more likely to democratise?
In this research question:
- Unit of analysis: Country
- Dependent variable: Regime type
- Independent variable: Level of education
The regime type is being caused by the independent variable, which is the level of education. But notice that for both variables, whether a country is a democracy or not and how high or low a country’s level of education is, how you are going to measure them is not trivial.
Level of education
Let’s focus for now on the level of education. How do we know if a country’s level of education is high or low? What information do we collect? What statistics, what sources are we going to look for in order to put a number on a country’s level of education?
The first step is to figure out a definition. When we think about a country’s level of education, what is it that we are thinking about? What is the defining feature of a country with a high level of education?
Defining the level of education
This is where everything starts to get a bit fuzzy. It is not as clear-cut as one would otherwise think. For example, you could define the level of education in terms of accessibility: how accessible is basic education to every citizen of a country? Or should we prioritise the proficiency of the students of a country, say the teenagers who go to school there: how proficient are they in reading, maths, and science?
The implications for research are not trivial, and a quick example illustrates how.
From definition to measurement
A different definition is going to result in a different measurement, and you are going to see how important it is for definitions and measurements to be consistent with one another.
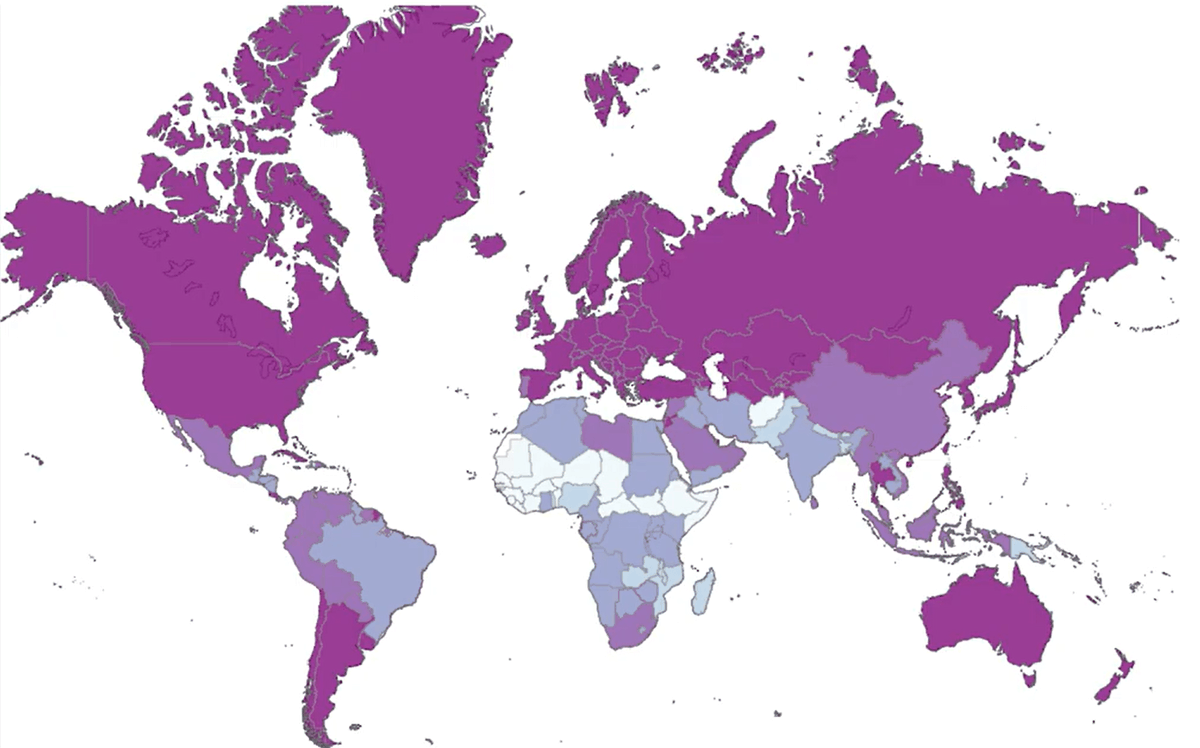
If we are focused on accessibility, one potential measurement could be the literacy rate. It is not the only potential measurement if we are defining the level of education in terms of accessibility, but it is a good, although not perfect, approximation. How accessible is basic education? Let’s see what percentage of the people in that country can read or write.
If we are looking at proficiency, then we could look at students’ standardised exam scores. This is done through the Programme for International Student Assessment, called PISA. The OECD, an international organisation, administers this standardised test to 15-year-old students in different countries, and then releases data on how well the students of each country did on the test.
Literacy rates
These are the literacy rates by country, colour-coded. This is a choropleth map: the darker the colour, the higher the literacy rate of the country.
PISA scores
And these are the PISA scores.
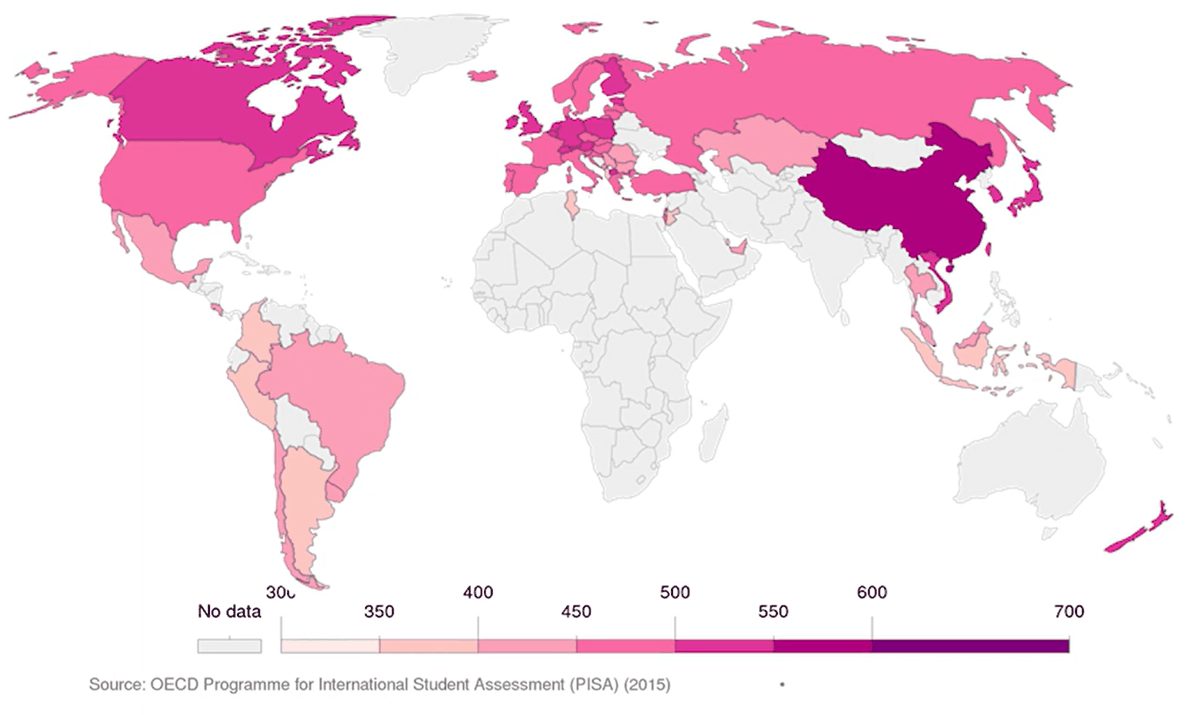
Let’s look at two countries closely in each of these maps: China and Argentina. If you can’t locate China and Argentina on the map, you can pause the video and look them up. Look at how dark China is, compared to Argentina, when you measure the level of education as proficiency on those standardised exams. Now go back to the literacy rates and compare Argentina to China.
Argentina is ahead of China in terms of literacy rates, but behind China in terms of PISA scores. So one could argue that accessibility is broader in Argentina, but proficiency is stronger for Chinese students. This is a brief illustration of how measurement choices are consequential for the results that you are eventually going to get, depending on what research question you are asking, what theory you are posing and what hypothesis you are proposing.
Back to the research question
Let’s go back to the research question.
Research question: Do higher levels of education make countries more likely to democratise?
How should we define and measure the level of education here? The two definitions and measurements above were only floated as possibilities. What they show is that before we come up with a definition and formulate a measurement strategy, we really need to pin down what the theory is and what the hypothesis is.
Recall, from an earlier video, the importance of the theory and the hypothesis in guiding us through the research and giving us a cue for where to go next. The very first step after the theory and the hypothesis depends on what your theory is and what your hypotheses are. Without them, you can’t really come up with a definition and a measurement for your variables that are consistent with how you are theorising and hypothesising.
If we were to theorise that higher levels of education make countries more likely to democratise, the theory would have to be specific about what it is about a country’s education level that makes democratisation more likely. Is it accessibility, or proficiency, for example? Or is it something else entirely, which would lead to an entirely different definition and an entirely different measurement?
Recap
- Different measurement strategies can lead to radically different conclusions.
- A suitable measurement depends on a suitable definition.
- Definitions and measurements must be consistent with our theories and hypotheses. Those choices ultimately depend on the theory, our plausible explanation for the answer to the research question, and on the hypothesis, what we should observe out in the world given our theory.
Why this matters
Measurement choices are highly consequential for the conclusions we can make. And inconsistencies between definitions, measurements, theories, and hypotheses can make entire research projects fall apart.